- On Thursday, 12/03/2020, the Global Stock Indices faced one of their worst days ever, with losses over 9% for the US Indices – the biggest percentage decline since 1987, and losses over 10% for the European Indices
- On Friday, 13/03/2020, the Global Stock Indices tried to “erase” some of their previous day’s losses:
- US Indices: 9%
- European Indices: 3%
- The Metals (Gold, Silver, Palladium, Platinum) faced losses the previous week:
- Gold: -8%
- Silver: -13%
- Palladium: -33%
- Crude Oil after the big decline on Monday’s Opening tried to recover during the week, price is at now 30.62, related to the Monday’s low, 9/03/2020, at 27.30
- Yesterday, Sunday 15/03/2020 , US Federal Reserve cut interest rates to zero and launched $700 billion quantitative easing program
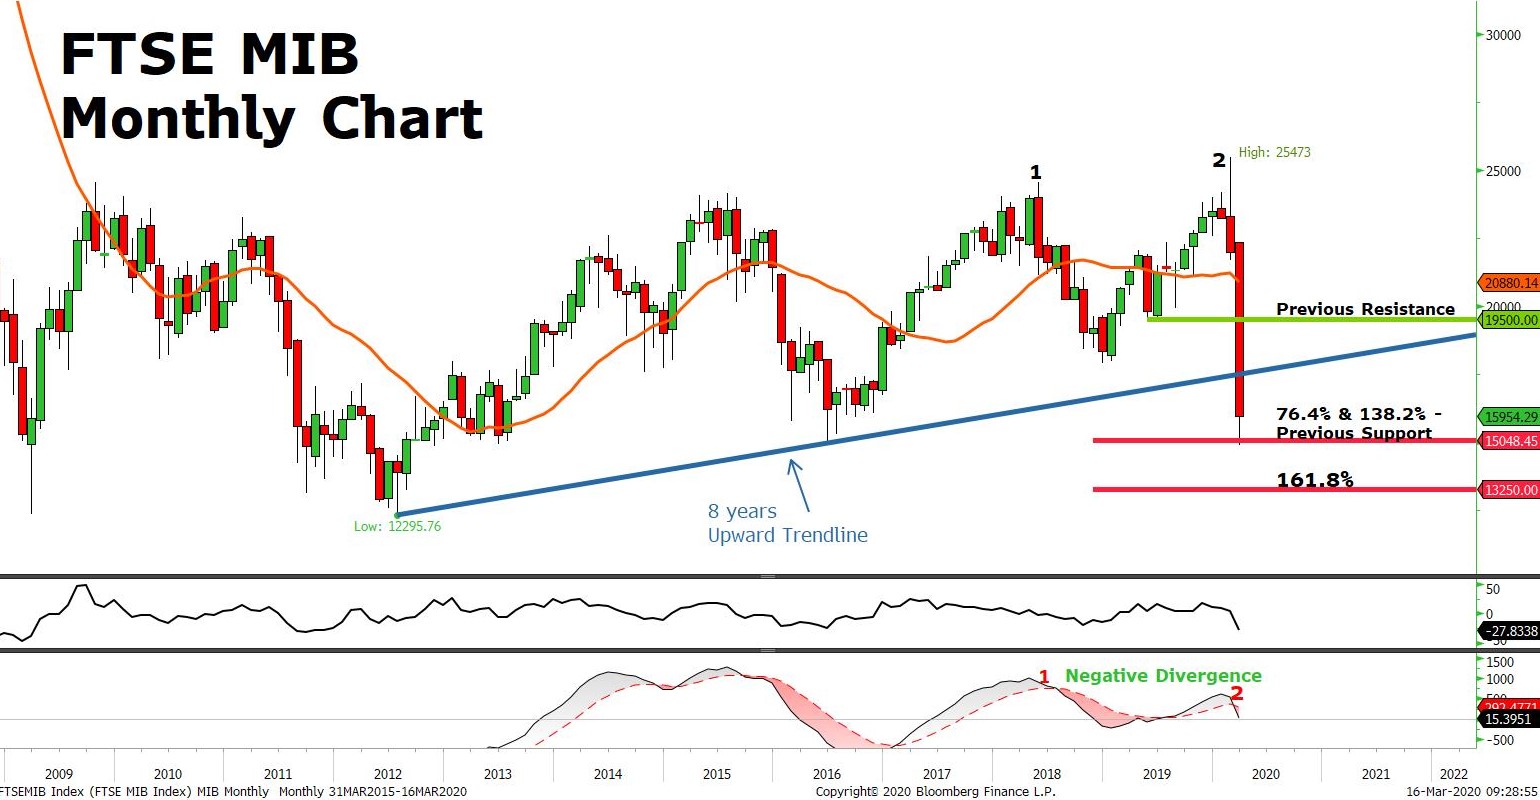
FTSE MIB Chart
- On the Italian MIB Stock Index, we can identify that the price has broken to the downside, stopping the 8 years upward trendline
- The price reacted at the 15,000 price mark which consists a previous support, the 76.4% Fibonacci Retracement Level (From 12,295 to 25,473), and the 138.2% Fibonacci extension level (From 17,959 to 25,473)
- Price now is at the 15,950 mark, and it is testing the long term upward trendline
- Price is below the 20 Months Moving Average
- On the Momentum Indicators, the Rate of Change of 6 months is below zero
- On the MACD indicator, we can observe a Negative Divergence, since the Last high (2) of the MACD is below the previous one (1) in relation with the higher highs of the MIB price. This could be considered as an early indication of possible further downward movement.
- Considering the above, if we observe a reaction of the price to the downside on the upward trendline and a closure of the current candlestick below the trendline it's possible to see the Italian Stock Index continue lower to test again the 15,000 level or lower to 13,250, and the 161.8% Fibonacci Extension Level (From 17,959 to 25,473)
- On the other hand, if the price returns above the trendline we might see it testing the 20,000 price mark, the previous inside resistance
Source : FXGM Investment Research Department / Bloomberg
