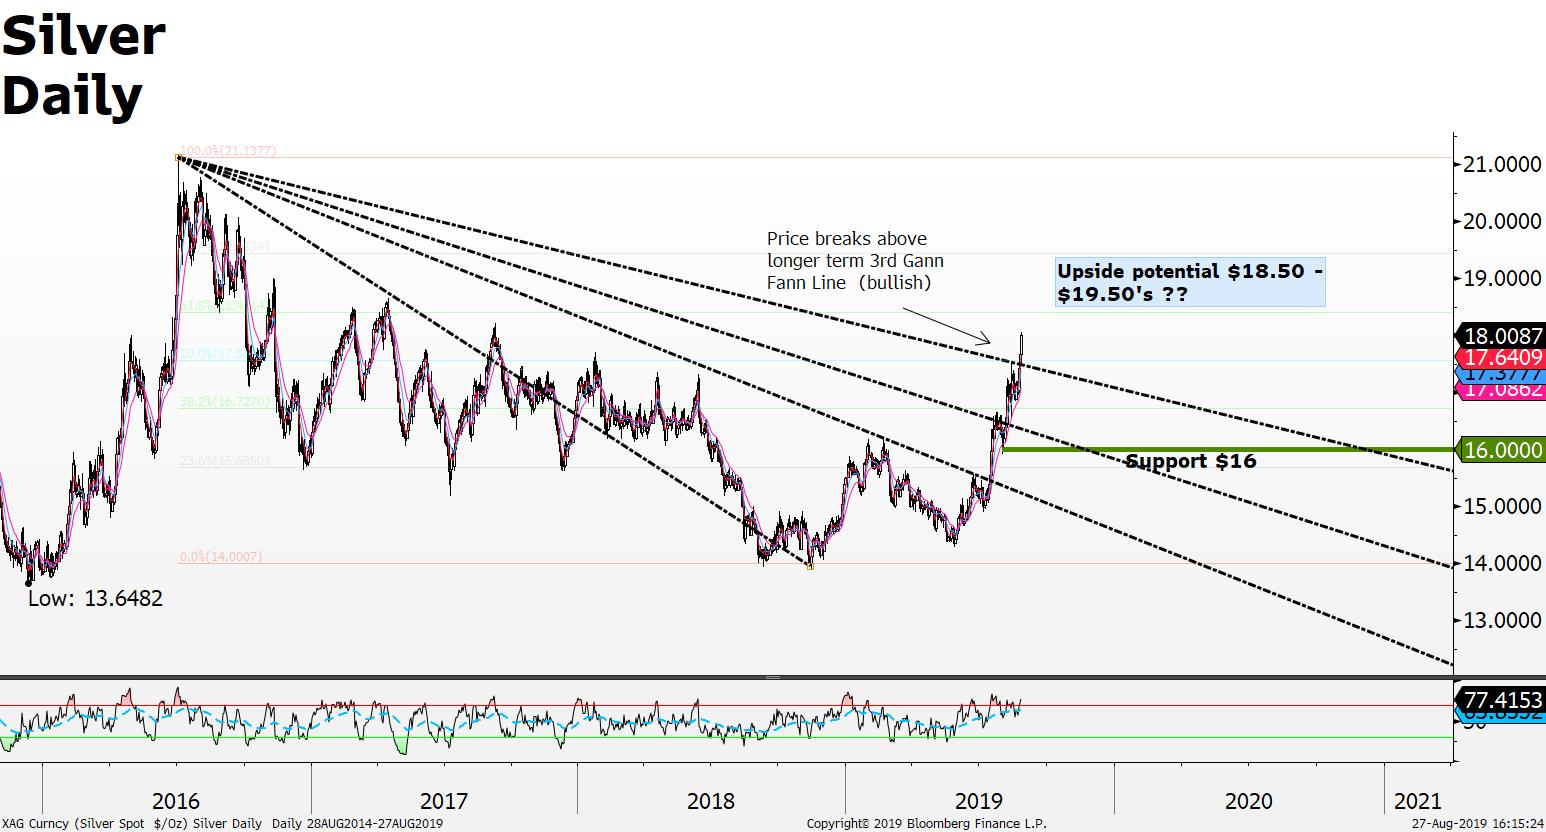
Historically precious metals including Gold, Silver and Platinum benefit from stock market volatility; the recent stock market volatility and looking back at the last US interest rate easing cycle 10-13 years ago we can indicate that stocks and precious metals may move higher together once stock market volatility settles down and markets adjust into a lower interest rate cycle.
Technical commentary: Silver longer term 5 year chart Gann Fann upside break-out (See Chart above); current price $17.97 fully retraced the 50% July 2016 high at $21.30 to the November 2018 double bottom (bullish) lows at $14 per ounce; provided price can remain above the $17.50's a short term (30 days or less) move to test the $18.50's to $19.50's 61.8 and 76.4% retracement levels remains on the table, otherwise a failure to hold above the $17.50 could open up a retest of the $16 support;
Source: FXGM / Bloomberg
