
Busy U.K. Economic Calendar today; U.K. GDP, industrial production, manufacturing production; and the Bank of England (BoE) members Andy Haldane and Michael Saunders are due to speak; GBP assets should be watch for price action; GBP/USD +43 pips last 5 days; FTSE 100 +2.6% last 5 days
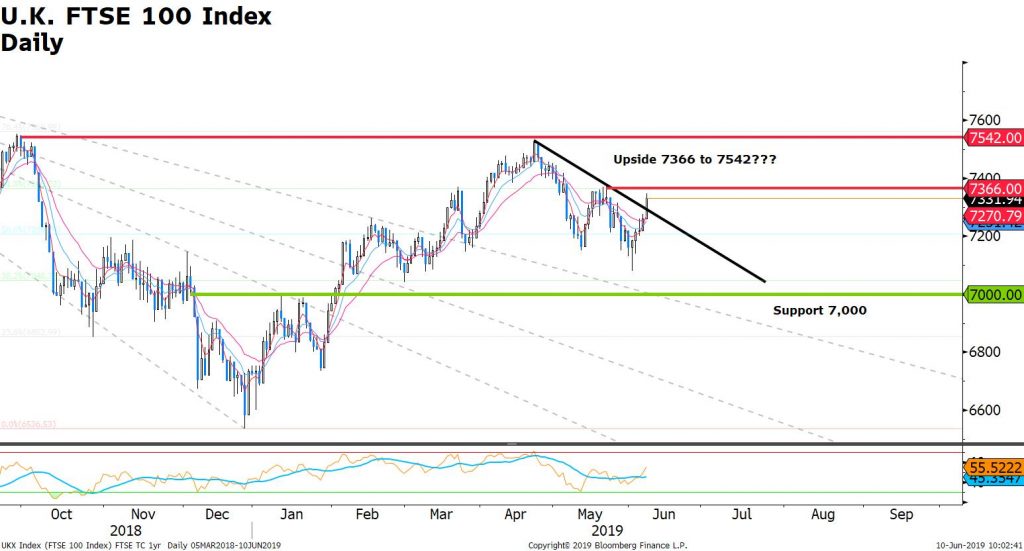
FTSE 100 Technical Analysis (Daily Chart): current price is trading above the multi-month downward trend-line (Bullish); RSI momentum analysis indicates RSI has crossed above its moving average (Bullish); current price 7310; resistance at 7366 a break above opens up the potential for a move towards 7542 resistance; otherwise provided price is unable to hold above 7366 a test of the 7,000 support level can not be ruled out.